

Key Takeaways
Total Cost of Ownership (TCO)
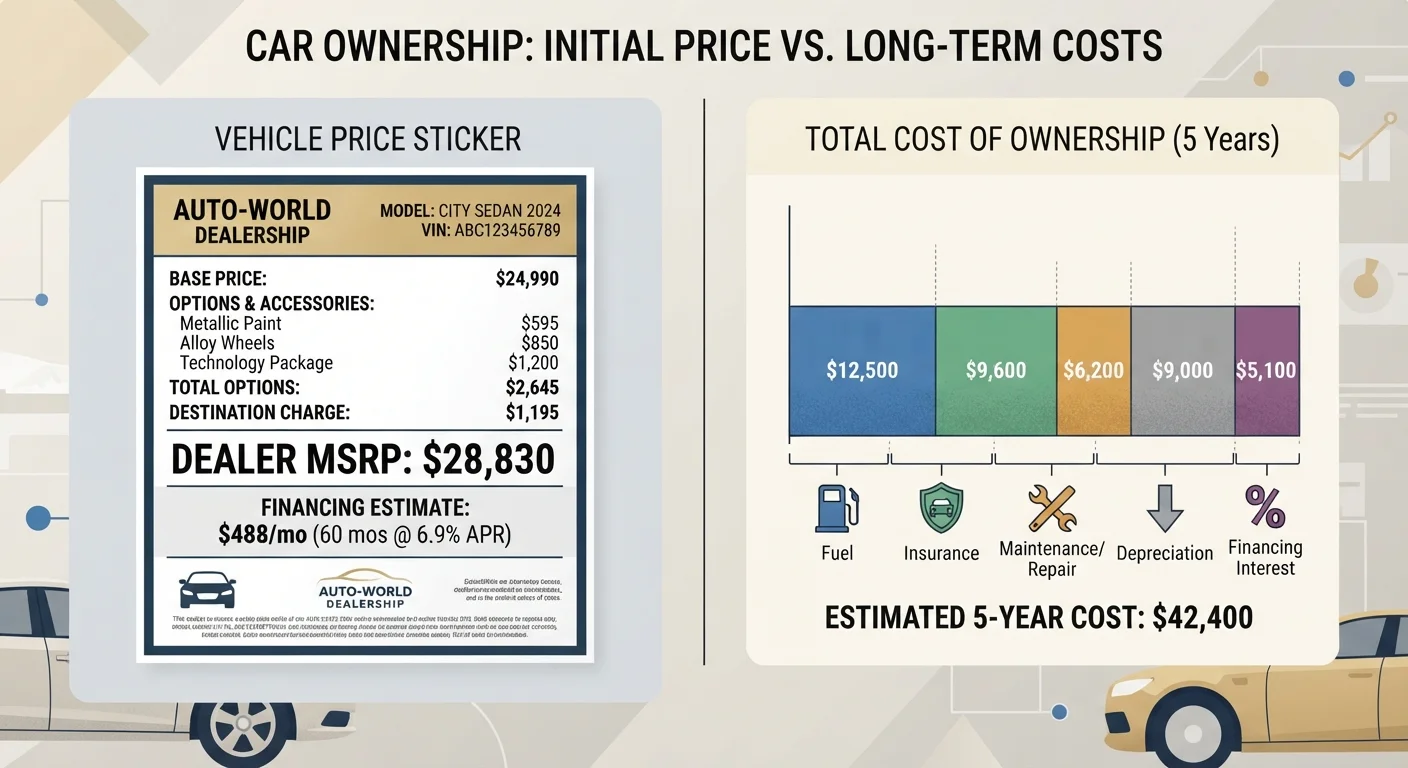
Total Cost of Ownership is the full amount a vehicle costs you over the time you own it — not just the purchase price. It adds up every predictable expense: loan interest, insurance premiums, fuel, routine maintenance, registration fees, and the value the car loses to depreciation. TCO gives you a more honest picture of what a vehicle truly demands from your budget each year.
Analysts typically calculate TCO over a five-year window, since depreciation — often the single largest cost component — is steepest in the first few years of ownership.
Why the Sticker Price Is the Wrong Number to Focus On
Walk into any dealership and the price printed on the window glass feels like the number. It's bold, it's concrete, and it's the figure most negotiations center on. But for most buyers, that number captures less than half of what they'll actually spend during the years they own the vehicle.
Consider two buyers who each pay $32,000 for a new car. One chooses a midsize SUV with a V6 engine; the other opts for a fuel-efficient compact sedan. Over five years, differences in fuel costs alone can exceed $5,000 — before accounting for the SUV's higher insurance premiums, larger tire replacement costs, and steeper depreciation curve. Same sticker price, very different financial outcomes.
This is exactly the problem that Total Cost of Ownership (TCO) is designed to solve. Instead of asking "What does it cost to buy?" TCO asks "What does it cost to own?" — a distinction that can reshape which vehicle actually makes sense for your budget. For a deeper look at one of the biggest TCO drivers, see our article on how car depreciation works.
~$12,000
Average annual cost to own and operate a new vehicle
According to AAA's annual Your Driving Costs study, the average American driver spends approximately $12,000 per year when all ownership costs are combined.
49%
Average value lost in first five years
Industry data consistently shows that many new vehicles lose roughly half their original value within five years, making depreciation the dominant TCO factor for most owners.
$5,600+
Interest paid on a typical 60-month auto loan
A $30,000 loan financed at 7% APR over five years generates more than $5,600 in interest charges — a cost absent from any sticker price.
The Six Cost Buckets That Make Up TCO
Breaking TCO into its components makes the concept less abstract and far more actionable. Here are the six areas that matter most:
- Depreciation: The gap between what you paid and what the vehicle is worth when you sell or trade it in. This is typically the largest single expense in a vehicle's TCO, often exceeding fuel costs over a five-year window.
- Financing: If you borrow to buy, interest charges add real money to the final cost. A $30,000 loan at 7% over 60 months generates roughly $5,600 in interest — money that doesn't appear anywhere on the sticker.
- Insurance: Premiums vary significantly by vehicle type, driver profile, location, and coverage level. Sports cars and large SUVs generally carry higher premiums than economy sedans.
- Fuel: Annual fuel spend depends on your driving habits, local gas prices, and the vehicle's efficiency rating. Even a modest 8 MPG difference between two vehicles can mean hundreds of dollars per year.
- Maintenance and repairs: Scheduled services, tires, brakes, and unexpected repairs all accumulate over time. Vehicles with known reliability track records or lower parts costs tend to outperform in this category.
- Registration and taxes: Annual registration fees and any state or local taxes vary by jurisdiction and sometimes by vehicle value or weight.
Our detailed guide to the numbers beyond the sticker price walks through how to estimate each category for a specific vehicle you're considering.
Run the Math Before the Test Drive
Estimate insurance costs, annual fuel spend, and five-year depreciation for any vehicle you're seriously considering before you visit a dealership. Arriving with these figures in hand prevents the sticker price from anchoring your judgment and helps you compare vehicles on a genuinely level playing field.
How to Use TCO Before You Sign Anything
You don't need a spreadsheet background to run a useful TCO comparison. A few targeted questions before you visit a dealership can reframe the whole decision.
Step 1: Set your ownership horizon. How long do you realistically plan to keep the vehicle? Three years, five years, ten? Depreciation front-loads costs, so short-term owners are hit hardest. Buyers who hold a vehicle for eight or more years often recover much of the depreciation hit through avoided car payments.
Step 2: Get realistic insurance quotes. Don't guess — call your insurer with the specific year, make, model, and trim before you commit. The difference between a standard sedan and a performance trim can be $600–$1,200 per year in premiums.
Step 3: Calculate annual fuel cost. Divide your expected annual mileage by the vehicle's combined MPG rating, then multiply by your area's average fuel price. Do this for each vehicle you're comparing.
Step 4: Factor in the resale estimate. Subtract the vehicle's projected resale value at your ownership horizon from its purchase price. That net figure — not the sticker — represents your true depreciation cost. Resources like automotive valuation guides can provide historical resale data by model.
This process pairs well with the broader pre-purchase framework in our pre-purchase checklist. And for a wider perspective on cost-per-unit thinking that applies across purchases, see the hidden costs that don't show up on the price tag.
The Practical Takeaway
Sticker price is useful for one thing: establishing a baseline for negotiation. It is not a reliable proxy for affordability, value, or fit. Two vehicles that look equivalent on the lot can diverge by tens of thousands of dollars in five-year cost once you account for all six TCO components.
The buyers who tend to feel most satisfied with their vehicle purchase are typically those who entered the process knowing their full-cost ceiling, not just their down payment comfort. Running even a rough TCO comparison — fuel, insurance, depreciation — before stepping onto a lot puts you in a fundamentally stronger position, regardless of which vehicle you ultimately choose.
For broader guidance on evaluating any vehicle purchase, the Car Buying Tips hub covers everything from financing to inspection checklists.