

Key Takeaways
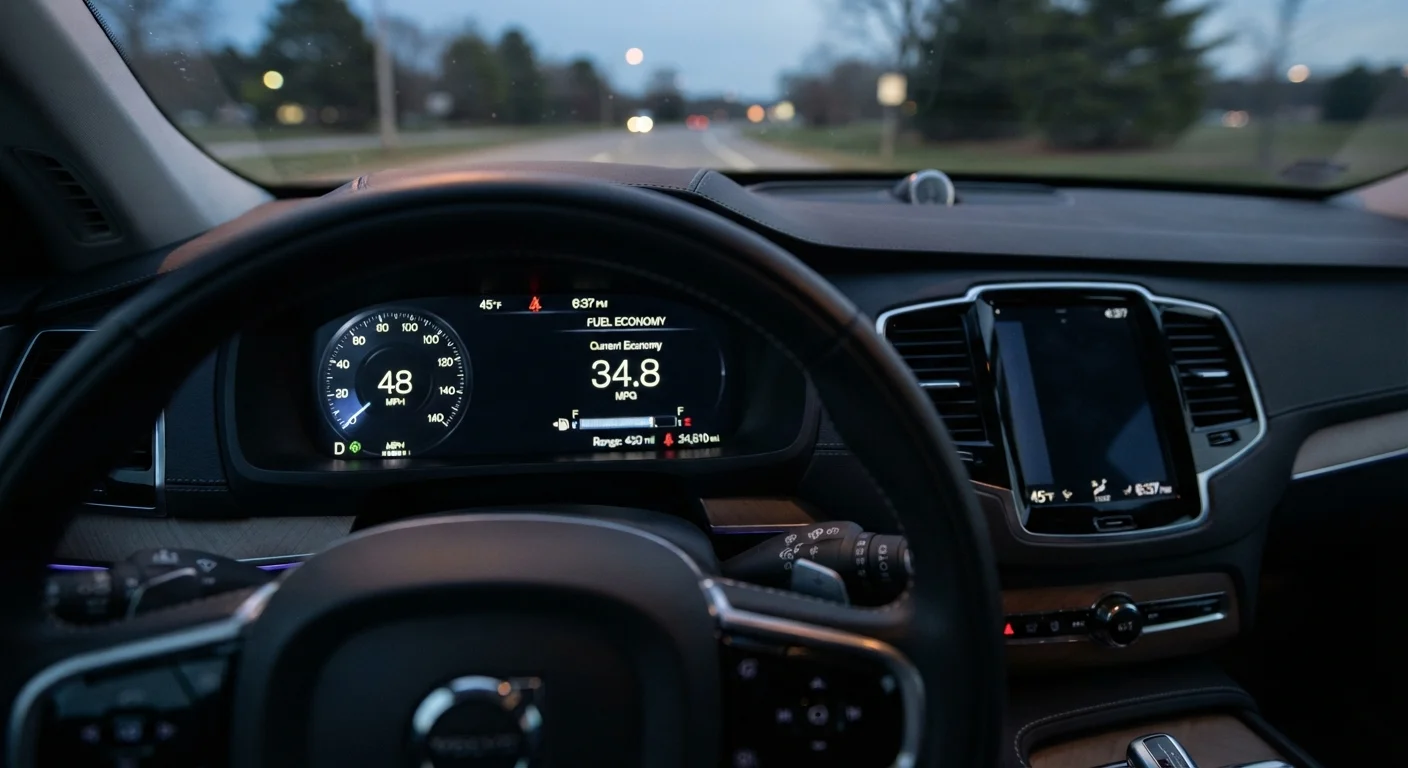
Fuel Economy Readout
A fuel economy readout is a digital display in your vehicle that shows how efficiently your engine is using fuel, typically measured in miles per gallon (MPG). Most modern vehicles show at least two figures: an instant reading that updates in real time, and an average reading calculated over a trip or longer period. Together, they give you a live snapshot and a broader trend of your driving efficiency.
Instant MPG is calculated from current fuel injector pulse width and vehicle speed sensors; average MPG integrates those readings over time or distance using the trip computer's onboard algorithm.
Two Numbers, Two Different Stories
Look at almost any modern dashboard and you'll find at least two fuel economy figures: one labeled "instant" and one labeled "average." Drivers often glance at them without understanding what each actually measures — or why they matter differently.
Instant MPG updates continuously, sometimes several times per second. It reflects what your engine is doing at that precise moment. Accelerating hard from a stoplight? Instant MPG craters. Coasting downhill with your foot off the gas? It may spike to 99 MPG or display infinity. This figure is volatile by nature — it's not meant to describe your driving over time, but to show you the immediate fuel cost of each action you take.
Average MPG, by contrast, is a rolling calculation over a set distance or time — typically since the last reset. This is the number that most closely predicts what you'll see when you divide your miles driven by gallons pumped at the next fill-up. It smooths out the spikes and dips of instant readings into a meaningful trend.
Trip Computer Reset Matters
Many drivers leave their average MPG running indefinitely, which means it reflects months of mixed driving. Resetting at each fill-up or at the start of a defined trip type gives you a meaningful baseline. An average that spans six months of varied conditions is too blended to act on.
Why Instant MPG Swings So Dramatically
The physics behind the instant readout are straightforward. Your engine consumes the most fuel when it's working hardest — pulling a heavy vehicle up to speed or climbing a grade. Fuel injectors pulse rapidly, delivering more fuel per second, and the MPG figure drops accordingly.
Conversely, when you're cruising at a steady speed on a level road, engine load is low, fuel delivery is minimal, and MPG climbs. This is why highway driving at moderate speeds tends to produce better fuel economy than stop-and-go city traffic — not because highways are inherently efficient, but because steady-state operation reduces the energy wasted on repeated acceleration cycles. For a deeper look at how each driving environment burns fuel differently, see our guide to highway vs. city fuel use.
The most actionable insight from the instant display: the steeper and faster your acceleration, the harder it hits your fuel economy. Smooth, gradual acceleration — often called "gentle throttle" technique — keeps the instant MPG from plunging and accumulates savings over a commute.
Watch the Instant Display During Acceleration
Try watching the instant MPG readout the next time you accelerate from a stop. Aim to keep the number from dropping below a threshold you set — say, 15 MPG — during your acceleration phase. This simple exercise trains a smoother throttle foot without requiring any app or external tool.
Using Average MPG as a Real Feedback Tool
The average MPG display becomes genuinely useful when you treat it like a running experiment. Reset it at every fill-up, then compare what it shows at the next pump visit against your calculated figure (miles driven ÷ gallons added). If the two numbers are consistently close, your trip computer is well-calibrated. If they diverge regularly, note the difference as a correction factor.
More importantly, watch how your average shifts with driving conditions. A week of highway commutes will lift it; a week of short cold-weather trips will drag it down. This isn't a flaw — it's the system accurately reflecting the real cost of those trips. Fuel expense is one of the significant recurring costs in vehicle ownership; for a fuller picture of how it fits into the bigger financial equation, understanding total cost of ownership puts fuel spending in context alongside insurance, maintenance, and financing.
~15%
Fuel economy gain from smoother driving habits
The U.S. Department of Energy estimates that aggressive driving — rapid acceleration and hard braking — can lower fuel economy by roughly 15–30% in city driving conditions.
0.4% per PSI
MPG loss per pound of tire underinflation
The U.S. Department of Energy notes that fuel economy can drop approximately 0.4% for every 1 PSI that all four tires are underinflated below the recommended level.
What the Readout Can't Tell You
The dashboard display has real limits. It doesn't account for fuel quality variations, ethanol content in your gas (which contains less energy per gallon than pure gasoline), or gradual changes in tire pressure — all of which affect real-world efficiency. Underinflated tires are a particularly common invisible drag on MPG that won't show up in your readout as a separate warning.
The readout also won't flag when your engine needs a tune-up, when an air filter is clogged, or when a failing oxygen sensor is skewing fuel delivery. A slow, unexplained decline in your average MPG over several weeks — without a change in driving pattern — is worth noting and potentially having inspected by a qualified mechanic.
Think of the fuel economy display as a behavioral mirror, not an engineering diagnostic. It tells you about your habits. A certified technician is the right resource when you suspect something mechanical is at work.